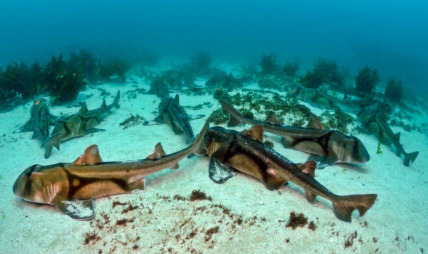
The Commonwealth of Port Jackson Shark
Freedom & Independence
Region: Safari
Quicksearch Query: Port Jackson Shark
|
Quicksearch: | |
NS Economy Mobile Home |
Regions Search |
Port Jackson Shark NS Page |
|
| GDP Leaders | Export Leaders | Interesting Places BIG Populations | Most Worked | | Militaristic States | Police States | |

Freedom & Independence
Region: Safari
Quicksearch Query: Port Jackson Shark
| Port Jackson Shark Domestic Statistics | |||
|---|---|---|---|
| Government Category: | Commonwealth | ||
| Government Priority: | Defence | ||
| Economic Rating: | Good | ||
| Civil Rights Rating: | Rare | ||
| Political Freedoms: | Very Good | ||
| Income Tax Rate: | 33% | ||
| Consumer Confidence Rate: | 94% | ||
| Worker Enthusiasm Rate: | 98% | ||
| Major Industry: | Arms Manufacturing | ||
| National Animal: | Port Jackson Shark | ||
| Port Jackson Shark Demographics | |||
| Total Population: | 2,285,000,000 | ||
| Criminals: | 247,806,356 | ||
| Elderly, Disabled, & Retirees: | 299,504,434 | ||
| Military & Reserves: ? | 99,656,049 | ||
| Students and Youth: | 403,302,500 | ||
| Unemployed but Able: | 357,366,624 | ||
| Working Class: | 877,364,038 | ||
| Port Jackson Shark Government Budget Details | |||
| Government Budget: | $6,877,895,427,584.17 | ||
| Government Expenditures: | $6,671,558,564,756.64 | ||
| Goverment Waste: | $206,336,862,827.53 | ||
| Goverment Efficiency: | 97% | ||
| Port Jackson Shark Government Spending Breakdown: | |||
| Administration: | $934,018,199,065.93 | 14% | |
| Social Welfare: | $533,724,685,180.53 | 8% | |
| Healthcare: | $467,009,099,532.97 | 7% | |
| Education: | $667,155,856,475.66 | 10% | |
| Religion & Spirituality: | $66,715,585,647.57 | 1% | |
| Defense: | $1,134,164,956,008.63 | 17% | |
| Law & Order: | $1,000,733,784,713.50 | 15% | |
| Commerce: | $400,293,513,885.40 | 6% | |
| Public Transport: | $333,577,928,237.83 | 5% | |
| The Environment: | $400,293,513,885.40 | 6% | |
| Social Equality: | $600,440,270,828.10 | 9% | |
| Port Jackson SharkWhite Market Economic Statistics ? | |||
| Gross Domestic Product: | $5,525,550,000,000.00 | ||
| GDP Per Capita: | $2,418.18 | ||
| Average Salary Per Employee: | $3,771.06 | ||
| Unemployment Rate: | 23.65% | ||
| Consumption: | $10,592,444,313,763.84 | ||
| Exports: | $2,193,244,774,400.00 | ||
| Imports: | $2,295,814,160,384.00 | ||
| Trade Net: | -102,569,385,984.00 | ||
| Port Jackson Shark Non Market Statistics ? Evasion, Black Market, Barter & Crime | |||
| Black & Grey Markets Combined: | $16,453,591,736,493.08 | ||
| Avg Annual Criminal's Income / Savings: ? | $5,646.00 | ||
| Recovered Product + Fines & Fees: | $1,851,029,070,355.47 | ||
| Black Market & Non Monetary Trade: | |||
| Guns & Weapons: | $717,898,487,073.99 | ||
| Drugs and Pharmaceuticals: | $520,216,294,981.15 | ||
| Extortion & Blackmail: | $832,346,071,969.84 | ||
| Counterfeit Goods: | $1,227,710,456,155.52 | ||
| Trafficking & Intl Sales: | $353,747,080,587.18 | ||
| Theft & Disappearance: | $665,876,857,575.88 | ||
| Counterfeit Currency & Instruments : | $1,560,648,884,943.46 | ||
| Illegal Mining, Logging, and Hunting : | $353,747,080,587.18 | ||
| Basic Necessitites : | $728,302,812,973.61 | ||
| School Loan Fraud : | $541,024,946,780.40 | ||
| Tax Evasion + Barter Trade : | $7,075,044,446,692.03 | ||
| Port Jackson Shark Total Market Statistics ? | |||
| National Currency: | Apexia | ||
| Exchange Rates: | 1 Apexia = $0.21 | ||
| $1 = 4.72 Apexias | |||
| Regional Exchange Rates | |||
| Gross Domestic Product: | $5,525,550,000,000.00 - 25% | ||
| Black & Grey Markets Combined: | $16,453,591,736,493.08 - 75% | ||
| Real Total Economy: | $21,979,141,736,493.08 | ||
| Safari Economic Statistics & Links | |||
| Gross Regional Product: | $4,284,914,388,172,800 | ||
| Region Wide Imports: | $594,439,781,220,352 | ||
| Largest Regional GDP: | Apexiala Wildlife Reserve | ||
| Largest Regional Importer: | Apexiala Wildlife Reserve | ||
| Regional Search Functions: | All Safari Nations. | ||
| Regional Nations by GDP | Regional Trading Leaders | |||
| Regional Exchange Rates | WA Members | |||
| Returns to standard Version: | FAQ | About | About | 483,687,949 uses since September 1, 2011. | |
Version 3.69 HTML4. V 0.7 is HTML1. |
Like our Calculator? Tell your friends for us... |